1. Creating separate profiles for different troubleshooting tasks
By default, when you open Wireshark, you are running the default profile. You can confirm this by looking at the bottom right corner of your Wireshark interface.

Now, within that default profile, you can make changes. For example, you can add a column for ‘Destination port’.
If you close Wireshark and re-open it after adding that column, the column remains available. In other words, it becomes part of your ‘Default’ profile.
But you may not always want to see that ‘Destination port’ column when troubleshooting certain issues. You might want to be able to see certain columns in a specific order, depending on what you are troubleshooting. This is where profiles can be useful.
By creating different profiles, you can open Wireshark and select your preferred profile that gives you the most convenient view for what you are troubleshooting.
By way of another example, one useful option when troubleshooting is creating another ‘time column’ for the time difference between displayed packets.
By default, the time column displays the number of seconds since the start of the capture, for each displayed packet. While this is useful, you may want to isolate just two different packets to see how much time elapsed between both packets being captured. This can be very useful for troubleshooting problems relating to delay – for example, if users are experiencing slow connectivity to an application.
To have a separate profile that contains this column, start by creating a new profile.
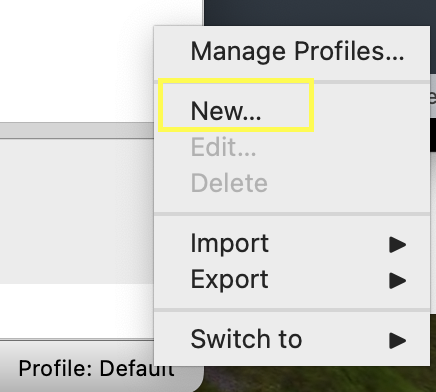
First, right-click the bottom right on your Wireshark window and click ‘New’

Give a name to the profile and click ‘Ok’. The newly created profile should now be in use in Wireshark (you can confirm this by checking that the profile displayed in the bottom right corner is the name of the profile you just created).

With the profile now configured, the next step is to add the new column to the profile.
To add this column on a Mac, in Wireshark, go to ‘Wireshark > Preferences’
Click on ‘Appearance > Columns’
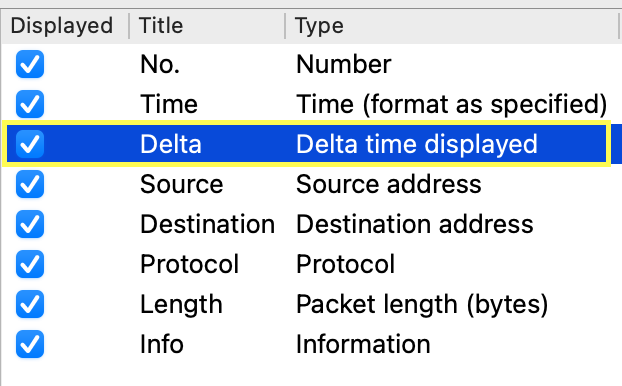
Click on ‘Add’ and under ‘Title’ give the column the preferred name, for example ‘Delta’.
Under ‘Type’, select ‘Delta time displayed’

Click ‘Ok’.
Your Wireshark interface should now include the new column.
Now, with two profiles available, when you open Wireshark, you can choose to use the ‘Default’ profile where the ‘Delta’ column does not exist, or you can switch to your newly created profile that has the ‘Delta’ column and other columns or settings of your choice.
2. Setting colours for specific traffic types
By default, Wireshark has specific colours it uses for different types of packets.
For example, both DNS queries and DNS responses have a blue background

When troubleshooting, you may want to have specific packet types in a different colour so that you can easily identify those packets.
For example, let’s say I want my DNS queries to remain in the default colour above, but I wanted packets for DNS query responses to be in ‘green’.
First, I want to find the filter used for identifying DNS query responses. I found the filter ‘dns.resp.type’ was a suitable filter.
Next, I click on ‘View > Coloring Rules’
This shows me the existing rules that are used to apply colours to packets in Wireshark.
I click on ‘Add’ and specify the name of my rule and the filter it should apply to. In this case, the filter is ‘dns.resp.type’ which I identified earlier. In the same window, select a background colour for your rule. In my case, I selected ‘green’
My rules now look like the below:

Now, when checking for a DNS query and response, I expect the packets for the DNS query response to be in green as shown below:

3. Using special filters like ‘contains’ and ‘matches’
Some filters make it easy to locate the packets that should be of interest to you. For example, you may be troubleshooting all traffic relating an FQDN such as symplifylearning.com. In a scenario where this FQDN resolves to multiple IP addresses, you may not want to limit your filter to just one of the IP addresses because DNS responses sent to different endpoints in your organization may have different IP addresses.
In this scenario, you could use filters like ‘contains’ and ‘match’ to see all packets where that FQDN is referenced. For example,

In the ‘protocol’ column in the screenshot above, notice that this filter captures not only the DNS query or response that relates to symplifylearning.com, but also the HTTPs traffic that includes that string.
NOTE: Using the ‘matches’ filter will display all packets that contain that string in both uppercase or lowercase. The ‘contains’ filter on the other hand is case-specific. For example, if you use the ‘contains’ filter in the scenario above to search for Symplifylearning (i.e uppercase S), no packets are displayed as seen below:

But the ‘matches’ filter will display all the results, even with an uppercase ‘S’ as shown below:


